Indicator “Unexpected association form”
Loading Tree…
Definition
The observed form of an association (e.g. linear, quadratic, exponential…) deviates from the expected form.
Explanation
Associations between data elements are not restricted to linear associations as expressed by Pearson correlation coefficients. Some measurements follow sigmoidal distributions and others appear to be of exponential growth. In such cases, linear association coefficients are deficient to describe the association between measurements.
Example
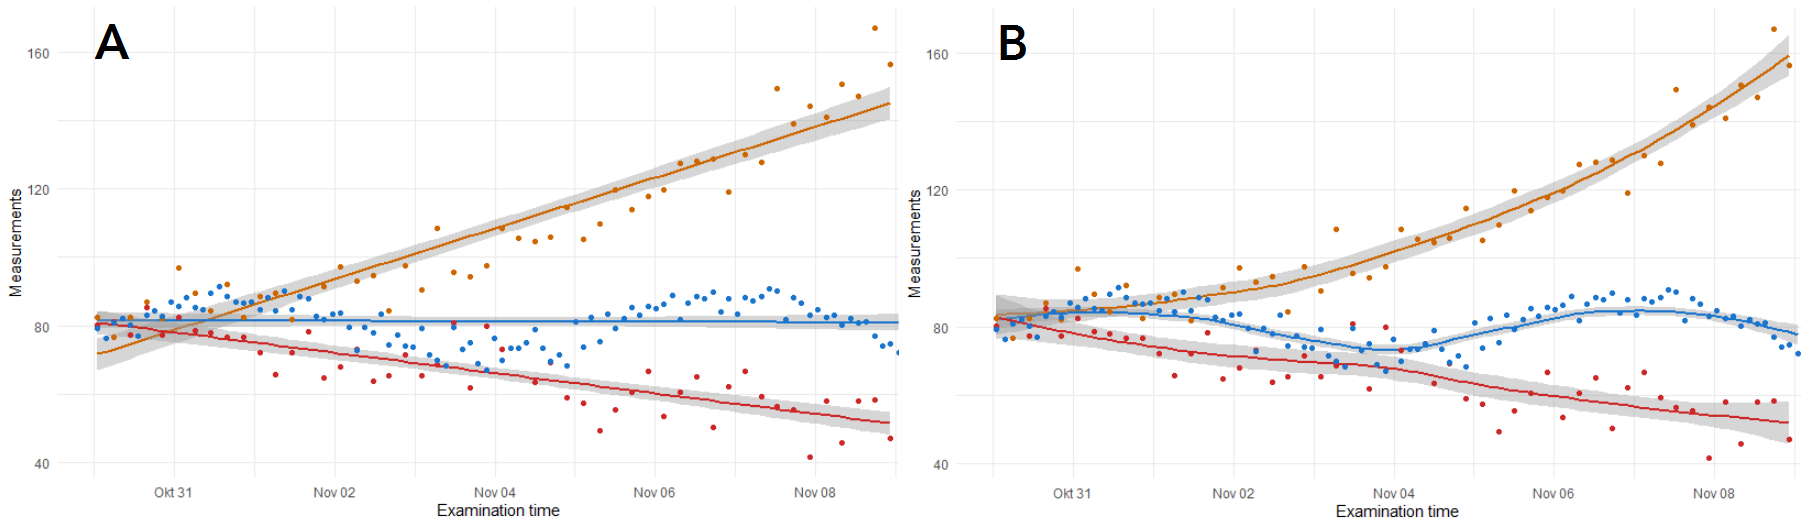
Assume the measurement of diastolic blood pressure in a cohort study conducted over several weeks by different examiners. Ideally, the association between measurements and time would be equal for all examiners. A linear association as shown in panel A of the figure may not describe the data best. For one examiner the measurements grow consistently over time, another generates data mimicking a sigmoidal curve, and the third examiner measures decreasing values of diastolic blood pressure.
Guidance
Checks of association forms require descriptive checks and visual examination of associations first. Such checks can be applied using simple scatterplots or smoothing plots. The quantification of deviations from expected association forms can be conducted using likelihood-based goodness-of-fit criteria such as Akaike-information-criteria (AIC). Using different functional relations between data elements, the best can be selected based on changes of the values, e.g. \(\\Delta\)AIC. The AIC penalizes the complexity of a model and favors parsimonious models. Please see also: Harrell Jr 2015.
Note: Different information criteria and modifications thereof are available (mAIC, pAIC, AICc, BIC). There is a lot of discussion on which criteria should be used (e.g. Wager et al. 2007). Nevertheless, regarding the choice of an observed association structure, they will work all fine.
Another obstacle in the quantification of different association forms are missing reference data. Reference data such as realistic and unbiased sample data are hardly available and therefore checks of unexpected association forms are often restricted to descriptive checks.
Interpretation
Severe deviations from expected association forms indicate errors in the data or in the measurement process. Causes for such deviations are manifold such as non-adherence to standard operating procedures (SOPs) or biased measurement devices.
Descriptors
Literature
Wager, Carrie, Florin Vaida, and Göran Kauermann. “Model selection for penalized spline smoothing using Akaike information criteria.” Australian & New Zealand Journal of Statistics 49.2 (2007): 173-190.
Harrell Jr, Frank E. Regression modeling strategies: with applications to linear models, logistic and ordinal regression, and survival analysis. Springer, 2015.
