Implementation/Documentation
Metadata requirements
Any extensive data quality report requires study data (for example, clinical measurements) and metadata. Metadata refers to attributes that describe expectations about the study data. Such expectations range from the number of expected observations in a data set to properties of single variables, such as data type or inadmissible values. The check of observed data properties against formalized expectations is the basis of most data quality indicators.
Metadata must be organized in a structured form to be easily usable.
For dataquieR, a spreadsheet-type structure with several
tables (as briefly described below) is used. These tables also describe
the objects of interest, such as variable names, variable and value
labels, or information to control the output generated in the
assessments, for instance, the role or order of variables in a report.
Depending on the requested type of checks only a subset of these tables
needs to be prepared.
The most relevant metadata tables are described below. Among these, the item-level metadata table is essential. Please bear in mind that updates and extensions of the metadata concept are a work in progress.
The metadata structure with its attributes is described in more detail in metadata annotation tutorial.
Item-level metadata
Item-level metadata refers to descriptions and expectations about single data elements (i.e., variables or items) such as inadmissibility ranges or data type.
Cross-item level metadata
Cross-item level metadata contains descriptions and expectations about the joint use of two or more data elements for data quality checks. A distinct table is necessary as there is a 1:n relationship of potential assessments to any single data element. It is used for example to implement contradiction checks.
Dataframe-level metadata
Dataframe-level metadata refers to descriptions and expectations about the provided data-frames such as the number of expected data records/observational units.
Segment-level metadata
Segment-level metadata refers to descriptions and expectations about the provided segments such as the number of observations. Segments refer for example to distinct examinations.
R
Below, we list all the existing implementations in the
dataquieR package (see Download for
installation instructions) with links to their respective documentation.
Additional examples, alternative implementations, and contributing code
guidelines are available as tutorials.
Indicator functions
List of all Functions
These are functions from dataquieR that can be used to
trigger single data quality checks. Their use is recommended for rather
specific applications. It may be easier to use the dq_report2 function for standard
reports.
Mapping the Concept to Functions
All dataquieR’s functions are linked to the underlying
data quality concept as described in the
table below.
Support functions
The indicator functions are aided by 258 support functions. The main task of
these functions is to ensure a stable operation of
dataquieR in light of potentially deficient data, which
requires extensive data preprocessing steps.
Stata
In Stata, the package dqrep can be used for data quality
analyses. It can be installed using the following command syntax:
net from https://packages.qihs.uni-greifswald.de/repository/stata/dqrep
net install dqrep, replace
Note: In case of issues when installing
dqrep with the net command, please download this package and extract the
files locally. Afterwards, they can be installed with the net command
using the local folder name.
Description
dqrep stands for “Data Quality REPorter”. This wrapper
command triggers an analysis pipeline to generate data quality
assessments. Assessments range from simple descriptive variable
overviews to full scale data quality reports that cover missing data,
extreme values, value distributions, observer and device effects or the
time course of measurements. Reports are provided as .pdf or .docx files
which are accompanied by a data set on assessment results. Reports are
highly customizable and visualize the severity and number of data
quality issues. In addition, there are options for benchmarking results
between examinations and studies.
There are two essentially different approaches to run
dqrep:
First, dqrep can be used to assess variables of the
active dataset. While most functionalities are available, checks that
depend on varying information at the variable level (e.g. range
violations) cannot be performed. Any variable used in a certain role
(e.g. observervars, keyvars) must be called for in
varlist.
Second, dqrep can be used to perform checks of variables
across a number of datasets that are specified in the targetfiles
option. In addition, a metadatafile can be specified that holds
information on variables and checks using the metadatafile option. This
allows for a more flexible application on variables in distinct data
sets, making use of all implemented dqrep
functionalities.
For more details on the conduct of dqrep see this help file.
Square\(^2\)
A Web Application for Data Monitoring in Epidemiological and Clinical Studies

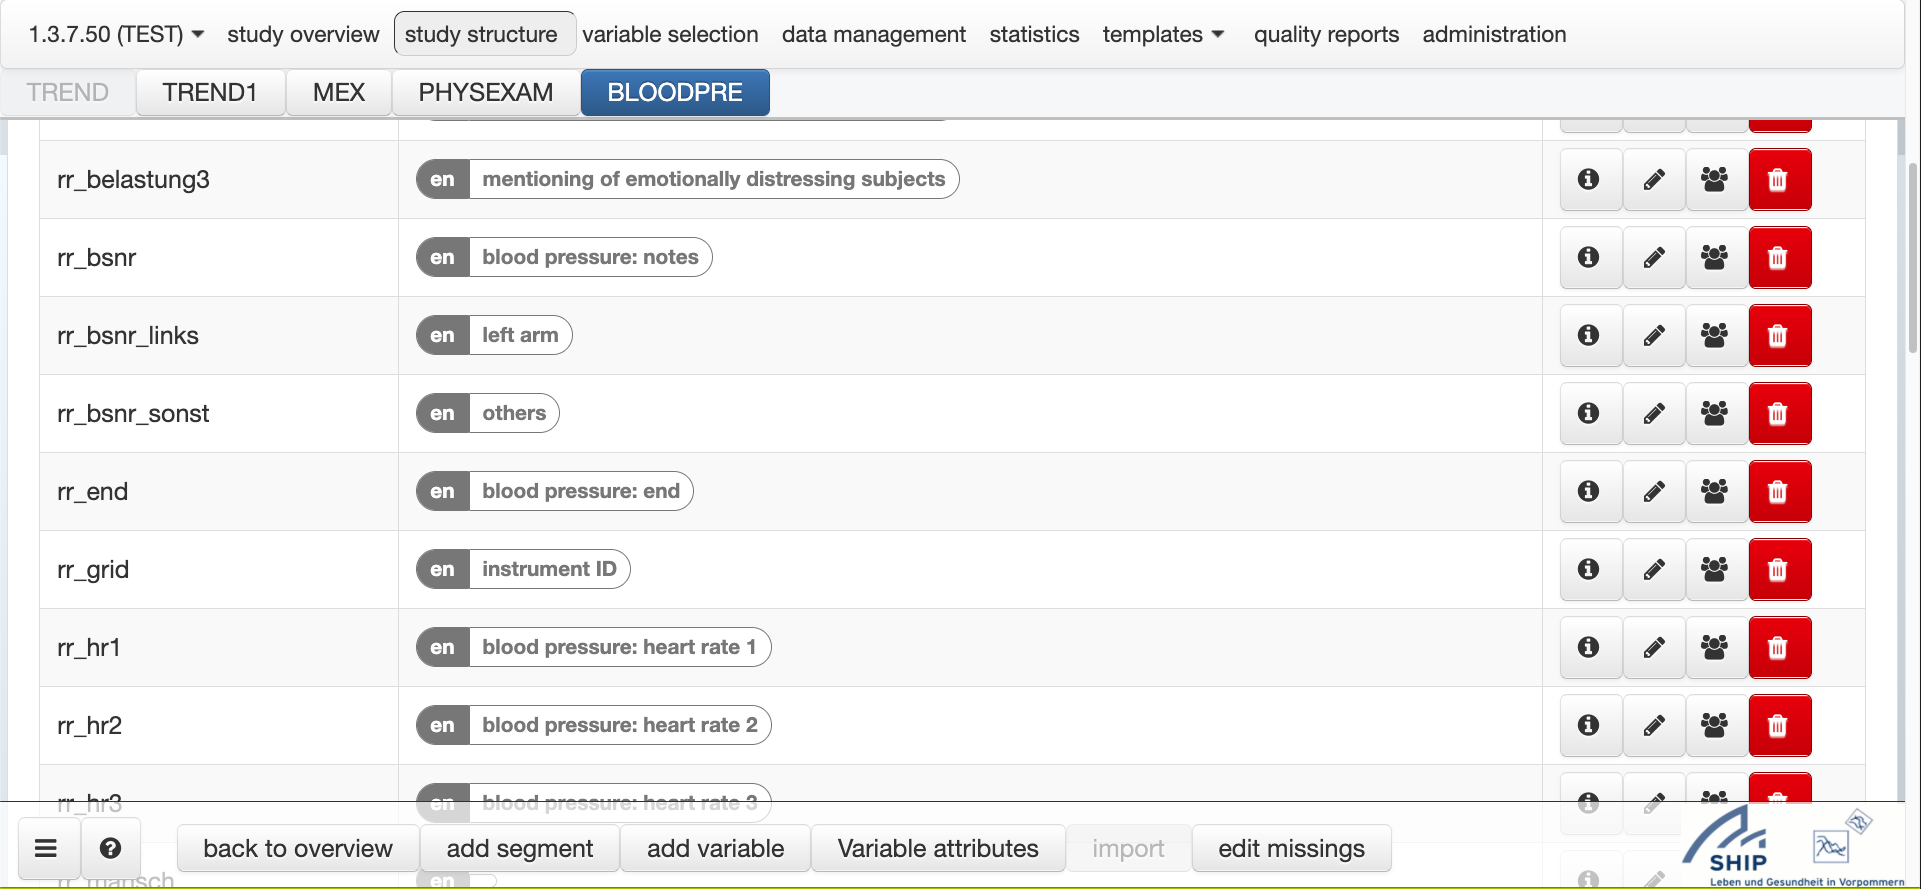
Square² is a JAVA web application that stores study data and metadata
in databases, and offers a graphical user interface (GUI) to target all
steps in the data quality assessment workflow. The application
differentiates between user types, enabling user rights and roles to
allow assessments without direct access to the study data or only. For
example, reporting may only be possible for assigned study data subsets.
From a data protection perspective, this is a huge advantage for complex
studies with many collaborators. All routines developed in this project
are integrated into Square², which can easily be extended by similar
packages that follow dataquieR’s code and metadata format conventions.
Square\(^2\) will be made available under the AGPL-3.0. The current version comes as a docker-stack (docker-compose.yml and images on request), which will be available from GitLab.com and Docker Hub.


