Indicator “Univariate outliers”
Loading Tree…
Definition
Numerical data values deviate markedly from others in a univariate analysis.
Explanation
Outliers refer to data values that differ strongly from others (Aguinis 2013). There are many approaches to detect outliers and any assessment results strongly depends on the chosen approach.
Example
The function acc_robust_univariate_outlier() identifies outliers according to the approaches of Tukey (1977), Saleem et al. (2021), Hubert (2008), and the heuristic approach of SigmaGap. The graphical output provides an overview on the number of rules according to which an outlier has been detected.
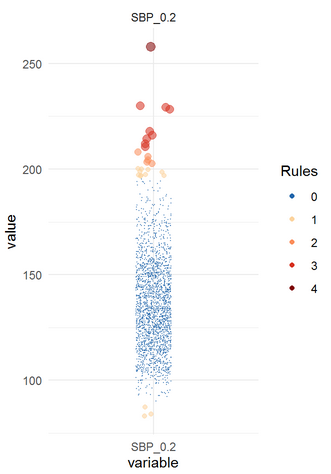
Figure 1: Histogram of body weight with outliers
While several data values meet at least one criterion for outliers only one data value meets all four criteria. It is up to the user to decide which criterion is of relevance.
Guidance
Univariate Outliers may strongly distort statistical analyses and must be checked for before conducting statistical analyses in numerical data elements.
Note: For data management purposes extreme values should preferably be dealt with by using admissibility limits with their associated consistency checks. The use of statistical outliers is potentially problematic because it may generate many test cases without relevance from a data management perspective. Nevertheless, if admissibility limits were not implemented during data entry, outliers should regularly be assessed by means of statistical rules.
Contrary to indicators belonging to the consistency dimension, outliers do not necessarily indicate a data error but also a data property, which may be of substantial interest from a substantial point of view (Aguinis 2013).
It is strongly recommended to take a graphical depiction of the distribution of a variable into account in addition to any statistical set of rules because the graph provides additional information on the interpretation of the observed outliers against the entire distribution.
The presence of outliers, even data values prove correct, may require adaptions of the statistical analysis approach.
Interpretation
Within variables:
The higher the count or percentage of variables affected by univariate outliers, the higher the probability of a low data quality.
Across variables:
The higher the number or percentage of variables affected by univariate outliers, the higher the probability of a low data quality.
Descriptors
Implementations
Literature
- Aguinis, H., R. K. Gottfredson and H. Joo (2013). “Best-Practice Recommendations for Defining, Identifying, and Handling Outliers.” Organizational Research Methods 16(2): 270-301.
