Definition and use of item level metadata
Introduction
The most basic data quality (DQ) assessments target single data elements (variables/items). Data quality assessments therefore require item level metadata. For detailed information on the item level metadata please see Richter et al. 2019. An overview on item level metadata used by dataquieR is provided below.
Item level metadata for data quality reporting
VARIABLE AND VALUE LABELS
VAR_NAMES
The first column specifies the variable name in the study data to be analysed. The input must be a string without blank spaces.
LABEL
Appropriate labels are a necessary precondition for readable data quality reports. Their absence, however, does not affect the functionality of the statistical implementations.
CAVEAT: A necessary convention for all labels in the current project phase is the definition of unique + short labels. This is necessary since labels that are too long may corrupt reports.
Assigning labels to variables is important because variable names in
the study data are rather technical and limiting to useful
interpretations. As variable names, each variable label should be
unique. In addition, labels should be as short as possible to ensure a
readable output. To enhance the presentation and plotting quality
character length specified in LABELS should not exceed 20
characters.
| VAR_NAMES | LABEL |
|---|---|
| v00000 | CENTER_0 |
| v00001 | PSEUDO_ID |
| v00002 | SEX_0 |
| v00003 | AGE_0 |
| v00103 | AGE_GROUP_0 |
All implementations of dataquieR support the use of
LABELS.
LONG_LABEL
Under some circumstances, a short label or variable name is insufficient to provide all necessary information. The column “LONG_LABEL” can be filled with self-explaining annotations for variables. Long labels are more relevant for tabular output than for graphical output.
Short or long labels can be defined in all implementations of
dataquieR by specifying the label_col formal
as an input.
VALUE_LABELS
Categorical variables in the study data are often coded as integers (e.g. 0, 1). Because the number is non-informative labels are essential to secure understandable reports, e.g:
- The sex of participants can be coded as \(0 = females\) and \(1 = males\).
- The presence of a disease can be coded as \(0 = no\) and \(1 = yes\).
To make use of VALUE_LABELS in dataquieR
the following convention has been made: all values of a study variable
and respective labels can be summarized in a list using the pipe
operator \(|\) for separation. For
example:
| VAR_NAMES | LABEL | VALUE_LABELS | |
|---|---|---|---|
| 3 | v00002 | SEX_0 | 0 = females | 1 = males |
| 12 | v00007 | ASTHMA_0 | 0 = no | 1 = yes |
To enhance presentation and plotting quality the character length of
a value label specified in VALUE_LABELS should not exceed
20 characters.
DATA_TYPE
In contrast to [LABEL] the definition of the DATA_TYPE
is crucial because the applicability of dataquieR functions
may depend on the data type.
The following DATA_TYPES are differentiated in
dataquieR:
- float
- integer
- datetime
- string
The list appears small compared to some electronic data capturing
systems (e.g. REDCap, Harris et al. 2009) or Shiny Apps
(Chang et al. 2018). However, the data type
should not be mixed up with data entry types which could be
very different using sliders or radio buttons.
Similarly, the data type is not a statistical property such as an
ordinal characteristic.
| VAR_NAMES | LABEL | DATA_TYPE | |
|---|---|---|---|
| 2 | v00001 | PSEUDO_ID | string |
| 3 | v00002 | SEX_0 | integer |
| 9 | v00004 | SBP_0 | float |
| 10 | v00005 | DBP_0 | float |
| 19 | v00013 | EXAM_DT_0 | datetime |
SCALE_LEVEL
The definition of the SCALE_LEVEL is important because
it defines what type of mathematical operations and
dataquieR functions can be applied to the data.
The following SCALE_LEVEL are allowed in
dataquieR:
- nominal
- ordinal
- interval
- ratio
- na
The category na is used for variables that do not fit in
the other categories (e.g., unstructured texts, json, xml).
MISSINGS
Data often contain a qualification of values which are not
measurements. These are for example codes for missing values. The figure
below shows the use of such codes in the variable V_0101.
Both, measurement values and missing codes are considered as data
values.
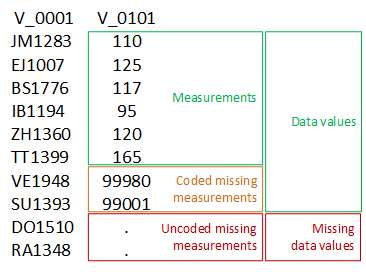
dataquieRUsing such codes may complicate the application of standardized routines for DQ assessment since coded missing measurements must be correctly interpreted. For example, it must be secured that a data value representing a missing code is not treated as a measurement value to avoid spurious results when addressing data accuracy. Therefore codes representing non-measurement values must be correctly identified and treated correctly.
dataquieR distinguishes missing codes through the
MISSING_LIST metadata column and jump codes by the
JUMP_LIST column. However, providing the codes in an
additional table called missing table
is recommended. For this, a string with the table name can be specified
in the column MISSING_LIST_TABLE, referring to a
spreadsheet in the same or another workbook or an URL.
CAVEAT: currently, within a variable,
dataquieR only accepts missing codes that match the data
type of the variable. For dates, for example, the missing table can only
contain missing codes in date time format, such as
1800.01.01 00:00:00 AM; and not numeric codes such as
99981. This must be kept in mind for the metadata columns
MISSING_LIST, JUMP_LIST and the
MISSING_LIST_TABLE.
MISSING_LIST
Codes specified in the MISSING_LIST indicate unexpected
missingness of measurements, for example missing values due to refusals
or technical problems.
The MISSING_LIST is a list of pipe \(|\) separated numeric codes: \(99980\: |\: 99983\: |\: 99988\).
JUMP_LIST
Codes in the JUMP_LIST indicate measurements which are
missing by design. For example, if a sub-sample of a study population
does not participate in a specific examination (by design) then
jump-codes should be used to indicate this reason for missingness.
The JUMP_LIST is a list of pipe \(|\) separated numeric codes: \(88880\: |\: 88883\: |\: 88884\).
MISSING_LIST_TABLE
The name and location of a table containing the missing assignments for the respective variable. The input must be a string and can refer to a spreadsheet in the same or another workbook.
In the example below, the missing codes for the variables are specified in the sheet called missing table of the same workbook.
| VAR_NAMES | LABEL | MISSING_LIST_TABLE | |
|---|---|---|---|
| 9 | v00004 | SBP_0 | missing_table |
| 10 | v00005 | DBP_0 | missing_table |
| 11 | v00006 | GLOBAL_HEALTH_VAS_0 | missing_table |
If the codes were defined in another workbook, the path and name of
the spreadsheet must be given. For example:
"d:/data/questionnaire_data_codes.xlsx | missing_codes".
LIMITS
Limits describe ranges to check the plausibility of measurement values (hard, soft limits) or to identify measurements outside a measurable range (detection limits). Limits may apply to study data of type: float, integer, and date-time. Specifying limits can be content-driven (e.g. based on clinical information) or may depend on properties of the used examination device or the outcome under study. For example, body weight cannot be negative.
Unfortunately, the definition of limits can be ambiguous:
- a plausibility limit of “\(\gt10\)” may imply that all values above are plausible.
- however, this notation is also frequently used to guide decisions in eCRFs, i.e. if a value is “\(\gt10\)” than alert the user regarding an implausible value.
To avoid this ambiguity, HARD_LIMITS,
SOFT_LIMITS, and DETECTION_LIMITS in the
metadata are defined using interval notation. Values inside the interval
are eligible/plausible/possible. The definition of intervals adheres
also to a distinguished use of braces:
- \((0;\:10)\): open interval, i.e. values \(>0\) and \(<10\) are inside the interval.
- \((0;\:10]\): left-open interval, i.e. values \(>0\) and \(\le10\) are inside the interval.
- \([0;\:10)\): right-open interval, i.e. values \(\ge0\) and \(<10\) are inside the interval.
- \([0;\:10]\): is a closed interval, i.e. values \(\ge0\) and \(\le10\) are inside the interval.
Each side of the interval must be defined by a value of the same type
as the measurement (including dates and date-times). If the range is
undefined \(-Inf\) and/or \(Inf\) have to be defined. Please see the
examples provided in [Metadata in dataquieR].
Two types of limits may be distinguished depending on whether the range indicates inadmissible or just unlikely values.
HARD_LIMITS
HARD_LIMITS should be specified to identify inadmissible
values. Inadmissibility does not necessarily mean impossible. For
example, while it is known that the heaviest man on Earth did weigh more
than 600kg, it may be reasonable to declare values above 250kg as
inadmissible because under the circumstances of a general-population
study in Germany it is deemed unlikely that a heavier person may arrive
at the examination center.
For example, for blood pressure measurements, we may specify the following hard limits.
| VAR_NAMES | LABEL | HARD_LIMITS | |
|---|---|---|---|
| 9 | v00004 | SBP_0 | [80;180] |
| 10 | v00005 | DBP_0 | [50;Inf) |
SOFT_LIMITS
The functionality of SOFT_LIMITS is similar to
HARD_LIMITS. However, values outside the limits are not
removed, because SOFT_LIMITS indicate improbable but not
impossible measurements.
The formal setup of SOFT_LIMITS is identical to
HARD_LIMITS, as shown in the metadata excerpt below.
| VAR_NAMES | LABEL | SOFT_LIMITS | |
|---|---|---|---|
| 9 | v00004 | SBP_0 | (90;170) |
| 10 | v00005 | DBP_0 | (55;100) |
DETECTION_LIMITS
The definition of DETECTION_LIMITS can be necessary if
measurement devices have predefined limits of sensitivity. It is
possible that measurements are indicated as being below or above the
DETECTION_LIMITS. Such information should result in a
different management of respective data values as they are still
informative and can be used in later analysis.
Values outside detection limits are not removed.
The formal setup of DETECTION_LIMITS is identical to
HARD_LIMITS and SOFT_LIMITS, as can be seen in
the metadata example below.
| VAR_NAMES | LABEL | DETECTION_LIMITS | |
|---|---|---|---|
| 9 | v00004 | SBP_0 | [0;265] |
| 10 | v00005 | DBP_0 | [0;265] |
| 21 | v00014 | CRP_0 | [0.16;Inf) |
REPORT DESIGN
VARIABLE_ROLE
This attribute is currently used only in internal functions.
VARIABLE_ORDER
In this column the order of the variables in a data quality report can be defined. For example, this column may be as follows.
| VAR_NAMES | LABEL | VARIABLE_ORDER |
|---|---|---|
| v00000 | CENTER_0 | 1 |
| v00001 | PSEUDO_ID | 2 |
| v00002 | SEX_0 | 3 |
| v00003 | AGE_0 | 4 |
How dataquieR uses item level metadata
dataquieR employs the predefined item level metadata in
two ways:
For each variable of the study data named in a function call of a DQ implementation, the respective metadata are interpreted from a data frame of metadata.
Some implementations also search for relations between variables, such as a date-time-stamp that belongs to a measurement. The section GROUP-COLUMNS explains the definition of such relations.
Therefore, metadata and study data must be defined in a 1:1
correspondence, i.e., each variable of the study data is identifiable in
the metadata. The key for this mapping is the
variable name, listed in the column VAR_NAMES in
the metadata. A necessary convention regarding variable names is their
uniqueness, i.e., none should have a duplicate (also implied by the 1:1
correspondence). Further, all metadata columns are defined in upper case
letters to distinguish them from the study data.
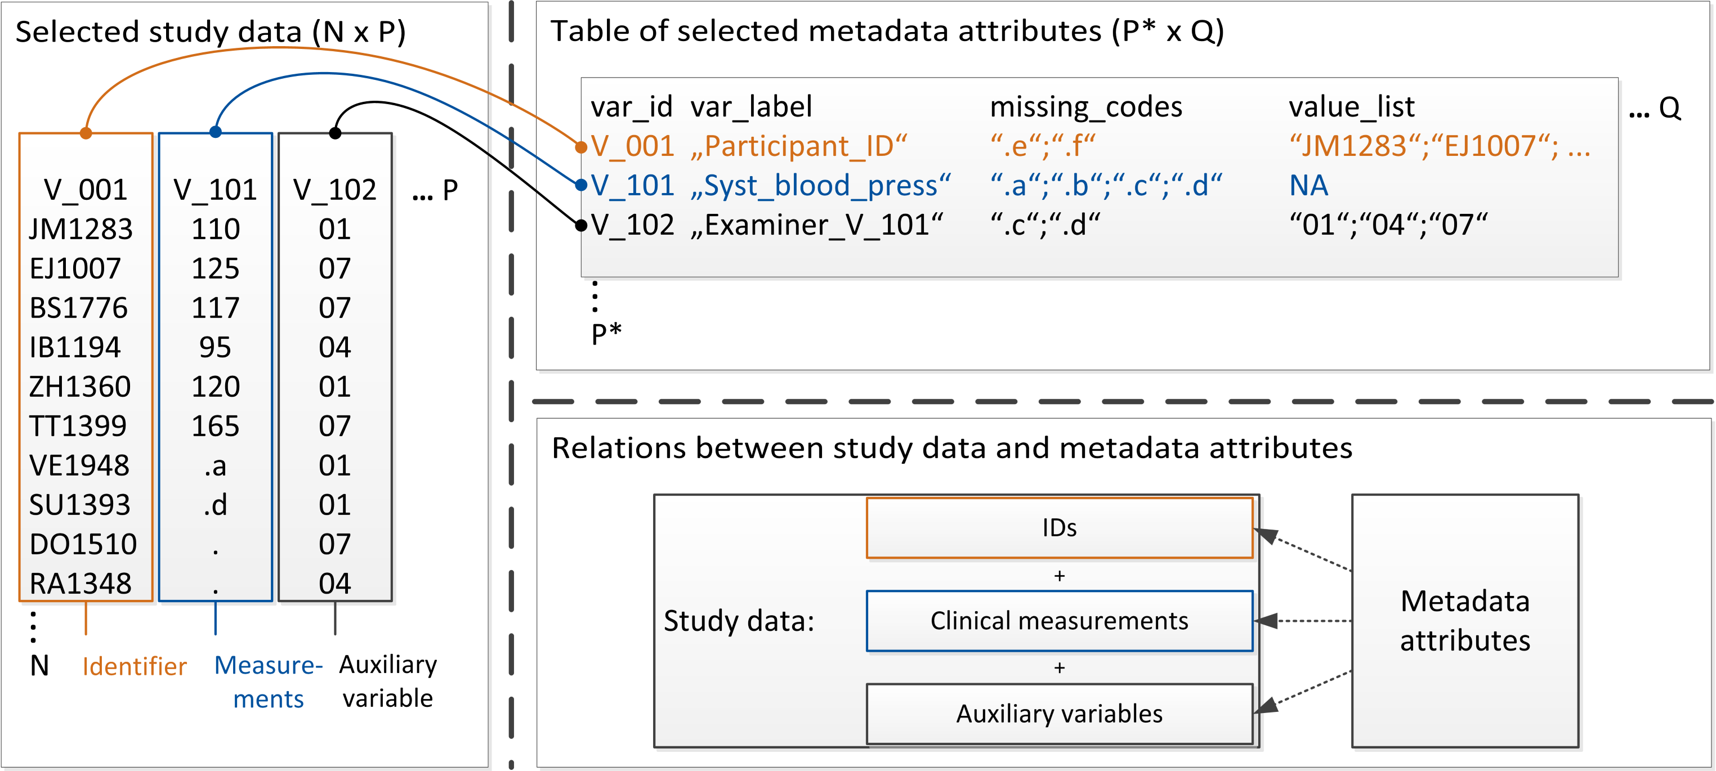
Typical item-level metadata are the variable name (or identifier), measurements (e.g., C-reactive protein or CRP), and process variables (e.g., examiner ID) (left panel in the figure below). In some cases, metadata variables must be added if appropriate metadata varies across observations. The link from the measurement variable (CRP) to the respective metadata variable (RefLimits_v101) is defined via its own column in the metadata. The top right panel of the figure below shows key_ref_limits, which specifies which variable contains the time-varying reference limits for CRP. Similar columns are denoted as group columns and point to the associated metadata variable. Such structural information is required to implement automated data quality assessment procedures. The bottom right panel of the figure below depicts the relationship between study data, metadata, and links between study data.
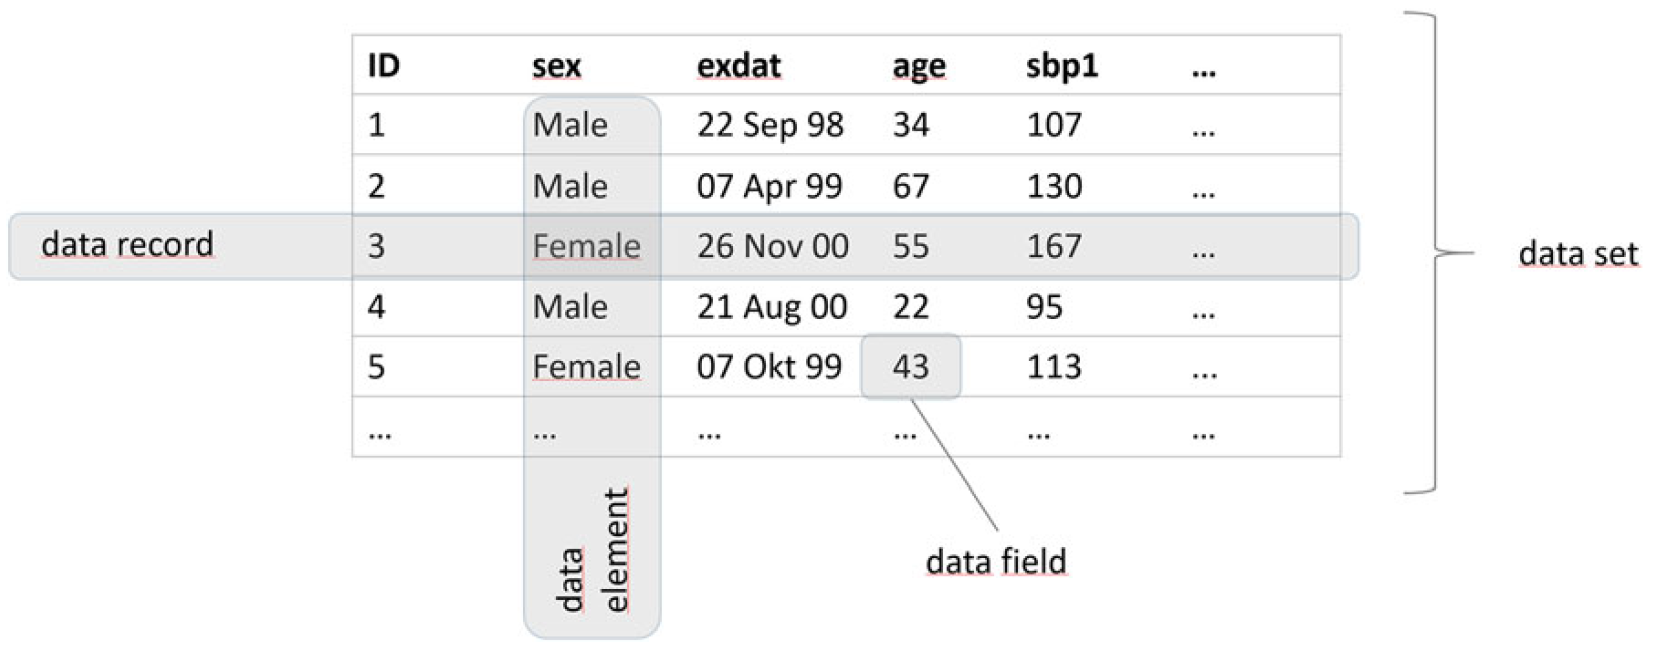
dataquieR uses the following terms for data
structures: