R implementation of inadmissible numerical values with respect to limits
Description
The function con_limit_deviations examines the
admissibility or uncertainty of numerical study data according to the
intervals defined in the metadata. The target values can be of type
integer, float or datetime. Thus,
con_limit_deviations is an implementation of the Inadmissible numerical values and Uncertain numerical values indicators,
as well as the Inadmissible time-date
values and Uncertain time-date
values indicators. These belong to the Range and value violations domain in the
Consistency dimension.
For more details, see the user’s manual and the source code.
Usage and arguments
con_limit_deviations(
  resp_vars = NULL,
  label_col = NULL,
  study_data = sd1,
  meta_data = md1,
  limits = c("HARD_LIMITS", "SOFT_LIMITS", "DETECTION_LIMITS")
)
The con_limit_deviations function has the following
arguments:
- resp_vars: the name of the continuous measurement variable
- label_col: if labels should be used specify column of metadata containing the labels
- limits: which limits should be investigated
(
HARD_LIMITS,SOFT_LIMITS, orDETECTION_LIMITS) - study_data: the name of the data frame that contains the measurements
- meta_data: the name of the data frame that contains item-level metadata
This implementation makes no use of thresholds.
CAVEAT:
In the naming of the following function we deviate from other
implementations. This is motivated by the generic use of a function that
can process different types of limits, i.e. if SOFT_LIMITS
or DETECTION_LIMITS. A necessary convention is the
identical definition of limits as shown in the next example.
Example output
To illustrate the output, we use the example synthetic data and metadata that are bundled with the dataquieR package. See the introductory tutorial for instructions on importing these files into R, as well as details on their structure and contents.
For the con_limit_deviations function, the columns
HARD_LIMITS, MISSING_LIST and
JUMP_LIST in the metadata are particularly relevant.
HARD_LIMITS have to be defined as intervals:
\([0; 100]\): any value between 0 and 100, including 0 or 100
\((0; 100)\): any value between 0 and 100, not including 0 or 100
\([0; Inf)\): any positive numerical value, including 0
This table shows the metadata defined for the example data that required for this implementation:
| VAR_NAMES | LABEL | MISSING_LIST | JUMP_LIST | HARD_LIMITS | |
|---|---|---|---|---|---|
| 4 | v00003 | AGE_0 | NA | NA | [18;Inf) |
| 39 | v00030 | MEDICATION_0 | 99980 | 99983 | 99988 | 99989 | 99990 | 99991 | 99993 | 99994 | 99995 | NA | [0;1] |
| 1 | v00000 | CENTER_0 | NA | NA | NA |
| 34 | v00025 | SMOKE_SHOP_0 | 99980 | 99983 | 99988 | 99989 | 99990 | 99991 | 99993 | 99994 | 99995 | NA | [0;4] |
| 23 | v00016 | DEV_NO_0 | NA | NA | NA |
| 43 | v40000 | PART_INTERVIEW | NA | NA | NA |
| 14 | v00009 | ARM_CIRC_0 | 99980 | 99981 | 99982 | 99983 | 99984 | 99985 | 99986 | 99987 | 99988 | 99989 | 99990 | 99991 | 99992 | 99993 | 99994 | 99995 | NA | [0;Inf) |
| 18 | v00012 | USR_BP_0 | 99981 | 99982 | NA | NA |
| 33 | v00024 | SMOKING_0 | 99980 | 99983 | 99988 | 99989 | 99990 | 99991 | 99993 | 99994 | 99995 | NA | [0;1] |
| 21 | v00014 | CRP_0 | 99980 | 99981 | 99982 | 99983 | 99984 | 99985 | 99986 | 99988 | 99989 | 99990 | 99991 | 99992 | 99994 | 99995 | NA | [0;Inf) |
However, this function can also be used with other columns of the
metadata that contain limit definitions according to the conventions
mentioned above. Currently, SOFT_LIMITS and
DETECTION_LIMITS are also handled by the function.
For selected response variables
The function can be applied on selected variables using a vector of response variables. The output comprises two tables and plots for each selected variable. The function checks whether the respective limits are specified for each selected variable. If not, a warning is supplied.
limit_deviations_1 <- con_limit_deviations(resp_vars  = c("AGE_0", "SBP_0", "SEX_0"),
                                      label_col  = "LABEL",
                                      study_data = sd1,
                                      meta_data  = md1,
                                      limits     = "HARD_LIMITS")
Output 1: FlaggedStudyData
The first table is related to the study data by a 1:1 relationship,
i.e. for each observation is checked whether the value is below or above
the limits. Call it with
limit_deviations_1$FlaggedStudyData:
Output 2: SummaryData
The second table summarizes this information for each variable. Use
limit_deviations_1$SummaryData to display it:
| Variables | Section | Limits | Number | Percentage |
|---|---|---|---|---|
| AGE_0 | below | HARD_LIMITS | 0 | 0 |
| AGE_0 | within | HARD_LIMITS | 2940 | 100 |
| AGE_0 | above | HARD_LIMITS | 0 | 0 |
| SBP_0 | below | HARD_LIMITS | 0 | 0 |
| SBP_0 | within | HARD_LIMITS | 2561 | 100 |
| SBP_0 | above | HARD_LIMITS | 0 | 0 |
| SBP_0 | below | DETECTION_LIMITS | 0 | 0 |
| SBP_0 | within | DETECTION_LIMITS | 2561 | 100 |
| SBP_0 | above | DETECTION_LIMITS | 0 | 0 |
| SBP_0 | below | SOFT_LIMITS | 0 | 0 |
| SBP_0 | within | SOFT_LIMITS | 2561 | 100 |
| SBP_0 | above | SOFT_LIMITS | 0 | 0 |
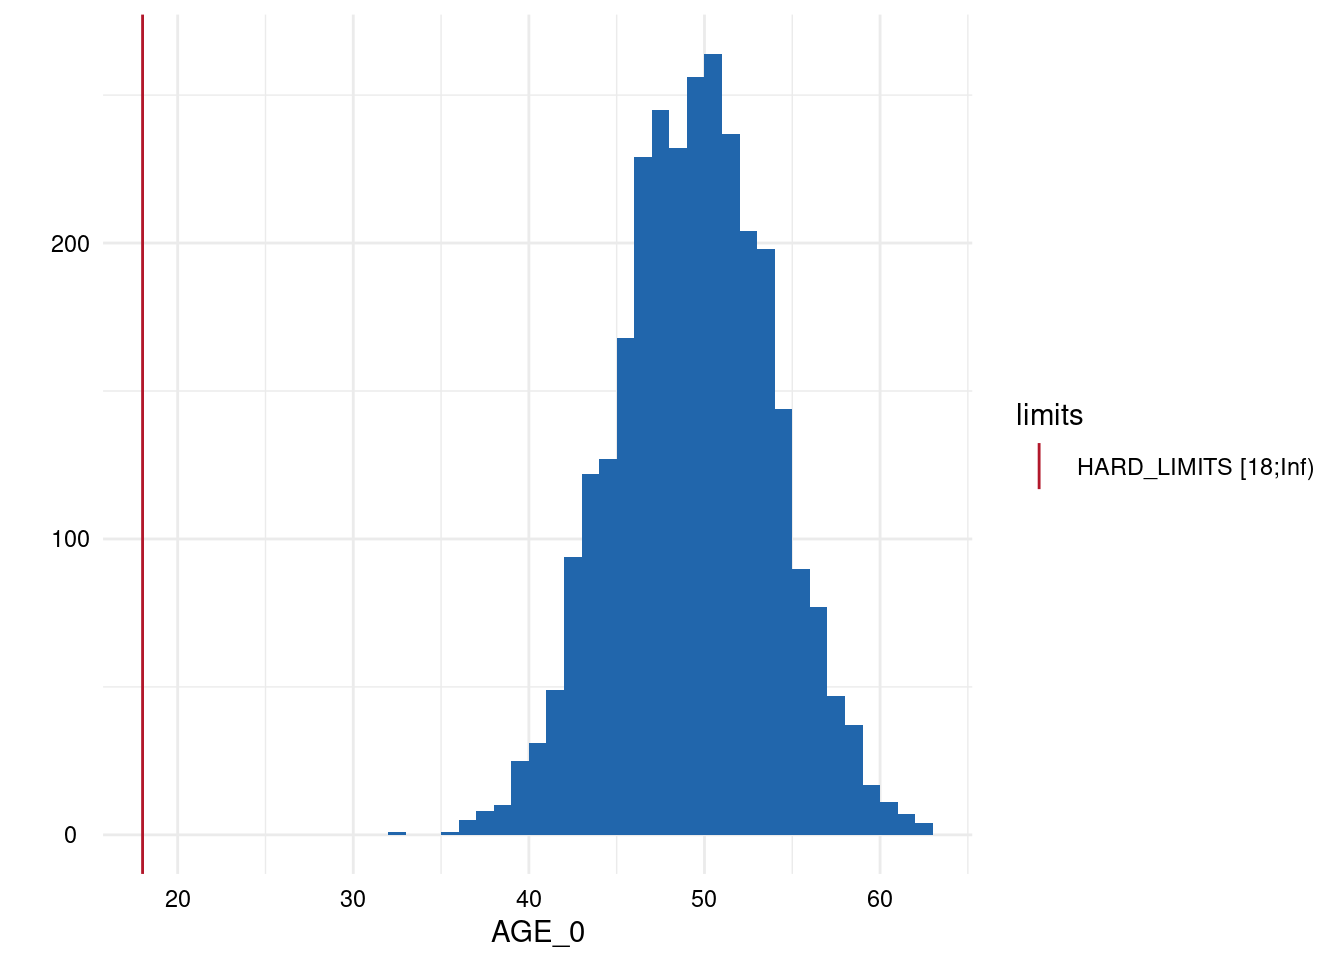
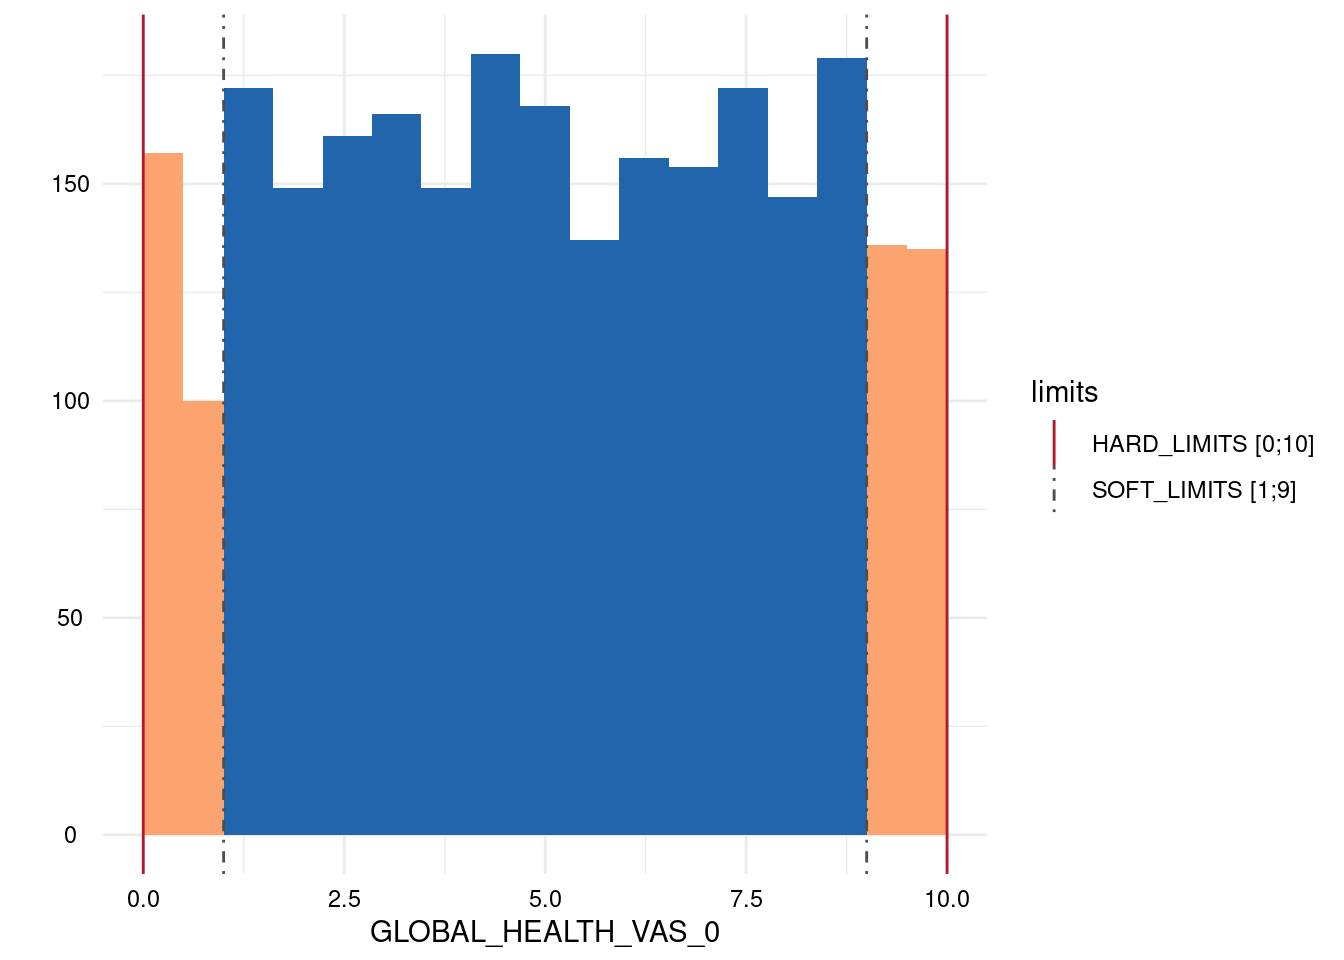
Output 3: SummaryPlotList
The plots for each variable are either a histogram (continuous) or a
barplot (discrete) and all are added to a list which is accessed via
MyValueLimits$SummaryPlotList.

Output 4: ModifiedStudyData
The fourth output object is a dataframe similar to the study data,
however, limit deviations have been removed. Access it using
limit_deviations_1$ModifiedStudyData.
Without specification of response variables
It is not necessary to specify variables. In this case the functions seeks for all numeric variables with defined limits. If the function identifies limit deviations, the respective values are removed in the dataframe of ModifiedStudyData.
limit_deviations_2 <- con_limit_deviations(label_col  = "LABEL",
                                      study_data = sd1,
                                      meta_data  = md1,
                                      limits     = "HARD_LIMITS")
## Did not find any 'SCALE_LEVEL' column in item-level meta_data. Predicting it from the data -- please verify these predictions, they may be wrong and lead to functions claiming not to be reasonably applicable to a variable.## All variables for which limits are specified in the metadata are used.Output 2: Summary data table
| Variables | Section | Limits | Number | Percentage |
|---|---|---|---|---|
| AGE_0 | below | HARD_LIMITS | 0 | 0.00 |
| AGE_0 | within | HARD_LIMITS | 2940 | 100.00 |
| AGE_0 | above | HARD_LIMITS | 0 | 0.00 |
| AGE_1 | below | HARD_LIMITS | 0 | 0.00 |
| AGE_1 | within | HARD_LIMITS | 2940 | 100.00 |
| AGE_1 | above | HARD_LIMITS | 0 | 0.00 |
| SBP_0 | below | HARD_LIMITS | 0 | 0.00 |
| SBP_0 | within | HARD_LIMITS | 2561 | 100.00 |
| SBP_0 | above | HARD_LIMITS | 0 | 0.00 |
| SBP_0 | below | DETECTION_LIMITS | 0 | 0.00 |
| SBP_0 | within | DETECTION_LIMITS | 2561 | 100.00 |
| SBP_0 | above | DETECTION_LIMITS | 0 | 0.00 |
| SBP_0 | below | SOFT_LIMITS | 0 | 0.00 |
| SBP_0 | within | SOFT_LIMITS | 2561 | 100.00 |
| SBP_0 | above | SOFT_LIMITS | 0 | 0.00 |
| DBP_0 | below | HARD_LIMITS | 0 | 0.00 |
| DBP_0 | within | HARD_LIMITS | 2544 | 100.00 |
| DBP_0 | above | HARD_LIMITS | 0 | 0.00 |
| DBP_0 | below | DETECTION_LIMITS | 0 | 0.00 |
| DBP_0 | within | DETECTION_LIMITS | 2544 | 100.00 |
| DBP_0 | above | DETECTION_LIMITS | 0 | 0.00 |
| DBP_0 | below | SOFT_LIMITS | 3 | 0.12 |
| DBP_0 | within | SOFT_LIMITS | 2470 | 97.09 |
| DBP_0 | above | SOFT_LIMITS | 71 | 2.79 |
| GLOBAL_HEALTH_VAS_0 | below | HARD_LIMITS | 0 | 0.00 |
| GLOBAL_HEALTH_VAS_0 | within | HARD_LIMITS | 2618 | 100.00 |
| GLOBAL_HEALTH_VAS_0 | above | HARD_LIMITS | 0 | 0.00 |
| GLOBAL_HEALTH_VAS_0 | below | SOFT_LIMITS | 257 | 9.82 |
| GLOBAL_HEALTH_VAS_0 | within | SOFT_LIMITS | 2090 | 79.83 |
| GLOBAL_HEALTH_VAS_0 | above | SOFT_LIMITS | 271 | 10.35 |
| ASTHMA_0 | below | HARD_LIMITS | 0 | 0.00 |
| ASTHMA_0 | within | HARD_LIMITS | 2641 | 100.00 |
| ASTHMA_0 | above | HARD_LIMITS | 0 | 0.00 |
| ARM_CIRC_0 | below | HARD_LIMITS | 0 | 0.00 |
| ARM_CIRC_0 | within | HARD_LIMITS | 2657 | 100.00 |
| ARM_CIRC_0 | above | HARD_LIMITS | 0 | 0.00 |
| ARM_CIRC_0 | below | SOFT_LIMITS | 0 | 0.00 |
| ARM_CIRC_0 | within | SOFT_LIMITS | 2657 | 100.00 |
| ARM_CIRC_0 | above | SOFT_LIMITS | 0 | 0.00 |
| ARM_CIRC_DISC_0 | below | HARD_LIMITS | 0 | 0.00 |
| ARM_CIRC_DISC_0 | within | HARD_LIMITS | 2633 | 100.00 |
| ARM_CIRC_DISC_0 | above | HARD_LIMITS | 0 | 0.00 |
| ARM_CUFF_0 | below | HARD_LIMITS | 0 | 0.00 |
| ARM_CUFF_0 | within | HARD_LIMITS | 2623 | 100.00 |
| ARM_CUFF_0 | above | HARD_LIMITS | 0 | 0.00 |
| EXAM_DT_0 | below | HARD_LIMITS | 0 | 0.00 |
| EXAM_DT_0 | within | HARD_LIMITS | 2940 | 100.00 |
| EXAM_DT_0 | above | HARD_LIMITS | 0 | 0.00 |
| CRP_0 | below | HARD_LIMITS | 0 | 0.00 |
| CRP_0 | within | HARD_LIMITS | 2699 | 100.00 |
| CRP_0 | above | HARD_LIMITS | 0 | 0.00 |
| CRP_0 | below | DETECTION_LIMITS | 5 | 0.19 |
| CRP_0 | within | DETECTION_LIMITS | 2694 | 99.81 |
| CRP_0 | above | DETECTION_LIMITS | 0 | 0.00 |
| CRP_0 | below | SOFT_LIMITS | 130 | 4.82 |
| CRP_0 | within | SOFT_LIMITS | 2561 | 94.89 |
| CRP_0 | above | SOFT_LIMITS | 8 | 0.30 |
| BSG_0 | below | HARD_LIMITS | 0 | 0.00 |
| BSG_0 | within | HARD_LIMITS | 2686 | 100.00 |
| BSG_0 | above | HARD_LIMITS | 0 | 0.00 |
| BSG_0 | below | SOFT_LIMITS | 92 | 3.43 |
| BSG_0 | within | SOFT_LIMITS | 2264 | 84.29 |
| BSG_0 | above | SOFT_LIMITS | 330 | 12.29 |
| LAB_DT_0 | below | HARD_LIMITS | 0 | 0.00 |
| LAB_DT_0 | within | HARD_LIMITS | 2940 | 100.00 |
| LAB_DT_0 | above | HARD_LIMITS | 0 | 0.00 |
| EDUCATION_0 | below | HARD_LIMITS | 0 | 0.00 |
| EDUCATION_0 | within | HARD_LIMITS | 2472 | 100.00 |
| EDUCATION_0 | above | HARD_LIMITS | 0 | 0.00 |
| EDUCATION_1 | below | HARD_LIMITS | 0 | 0.00 |
| EDUCATION_1 | within | HARD_LIMITS | 2422 | 99.88 |
| EDUCATION_1 | above | HARD_LIMITS | 3 | 0.12 |
| MARRIED_0 | below | HARD_LIMITS | 0 | 0.00 |
| MARRIED_0 | within | HARD_LIMITS | 2366 | 100.00 |
| MARRIED_0 | above | HARD_LIMITS | 0 | 0.00 |
| N_CHILD_0 | below | SOFT_LIMITS | 0 | 0.00 |
| N_CHILD_0 | within | SOFT_LIMITS | 2249 | 96.28 |
| N_CHILD_0 | above | SOFT_LIMITS | 87 | 3.72 |
| EATING_PREFS_0 | below | HARD_LIMITS | 0 | 0.00 |
| EATING_PREFS_0 | within | HARD_LIMITS | 2328 | 100.00 |
| EATING_PREFS_0 | above | HARD_LIMITS | 0 | 0.00 |
| MEAT_CONS_0 | below | HARD_LIMITS | 0 | 0.00 |
| MEAT_CONS_0 | within | HARD_LIMITS | 2302 | 100.00 |
| MEAT_CONS_0 | above | HARD_LIMITS | 0 | 0.00 |
| SMOKING_0 | below | HARD_LIMITS | 0 | 0.00 |
| SMOKING_0 | within | HARD_LIMITS | 2292 | 100.00 |
| SMOKING_0 | above | HARD_LIMITS | 0 | 0.00 |
| SMOKE_SHOP_0 | below | HARD_LIMITS | 0 | 0.00 |
| SMOKE_SHOP_0 | within | HARD_LIMITS | 782 | 97.02 |
| SMOKE_SHOP_0 | above | HARD_LIMITS | 24 | 2.98 |
| N_INJURIES_0 | below | SOFT_LIMITS | 0 | 0.00 |
| N_INJURIES_0 | within | SOFT_LIMITS | 2161 | 98.27 |
| N_INJURIES_0 | above | SOFT_LIMITS | 38 | 1.73 |
| N_BIRTH_0 | below | SOFT_LIMITS | 0 | 0.00 |
| N_BIRTH_0 | within | SOFT_LIMITS | 1098 | 99.91 |
| N_BIRTH_0 | above | SOFT_LIMITS | 1 | 0.09 |
| PREGNANT_0 | below | HARD_LIMITS | 0 | 0.00 |
| PREGNANT_0 | within | HARD_LIMITS | 1065 | 100.00 |
| PREGNANT_0 | above | HARD_LIMITS | 0 | 0.00 |
| MEDICATION_0 | below | HARD_LIMITS | 0 | 0.00 |
| MEDICATION_0 | within | HARD_LIMITS | 292 | 45.55 |
| MEDICATION_0 | above | HARD_LIMITS | 349 | 54.45 |
| N_ATC_CODES_0 | below | HARD_LIMITS | 0 | 0.00 |
| N_ATC_CODES_0 | within | HARD_LIMITS | 2058 | 100.00 |
| N_ATC_CODES_0 | above | HARD_LIMITS | 0 | 0.00 |
| INT_DT_0 | below | HARD_LIMITS | 0 | 0.00 |
| INT_DT_0 | within | HARD_LIMITS | 2940 | 100.00 |
| INT_DT_0 | above | HARD_LIMITS | 0 | 0.00 |
| ITEM_1_0 | below | HARD_LIMITS | 0 | 0.00 |
| ITEM_1_0 | within | HARD_LIMITS | 2248 | 100.00 |
| ITEM_1_0 | above | HARD_LIMITS | 0 | 0.00 |
| ITEM_2_0 | below | HARD_LIMITS | 0 | 0.00 |
| ITEM_2_0 | within | HARD_LIMITS | 2197 | 100.00 |
| ITEM_2_0 | above | HARD_LIMITS | 0 | 0.00 |
| ITEM_3_0 | below | HARD_LIMITS | 0 | 0.00 |
| ITEM_3_0 | within | HARD_LIMITS | 2184 | 100.00 |
| ITEM_3_0 | above | HARD_LIMITS | 0 | 0.00 |
| ITEM_4_0 | below | HARD_LIMITS | 0 | 0.00 |
| ITEM_4_0 | within | HARD_LIMITS | 2143 | 100.00 |
| ITEM_4_0 | above | HARD_LIMITS | 0 | 0.00 |
| ITEM_5_0 | below | HARD_LIMITS | 0 | 0.00 |
| ITEM_5_0 | within | HARD_LIMITS | 2074 | 100.00 |
| ITEM_5_0 | above | HARD_LIMITS | 0 | 0.00 |
| ITEM_6_0 | below | HARD_LIMITS | 0 | 0.00 |
| ITEM_6_0 | within | HARD_LIMITS | 2048 | 100.00 |
| ITEM_6_0 | above | HARD_LIMITS | 0 | 0.00 |
| ITEM_7_0 | below | HARD_LIMITS | 0 | 0.00 |
| ITEM_7_0 | within | HARD_LIMITS | 2068 | 100.00 |
| ITEM_7_0 | above | HARD_LIMITS | 0 | 0.00 |
| ITEM_8_0 | below | HARD_LIMITS | 0 | 0.00 |
| ITEM_8_0 | within | HARD_LIMITS | 2013 | 100.00 |
| ITEM_8_0 | above | HARD_LIMITS | 0 | 0.00 |
| QUEST_DT_0 | below | HARD_LIMITS | 9 | 0.31 |
| QUEST_DT_0 | within | HARD_LIMITS | 2931 | 99.69 |
| QUEST_DT_0 | above | HARD_LIMITS | 0 | 0.00 |
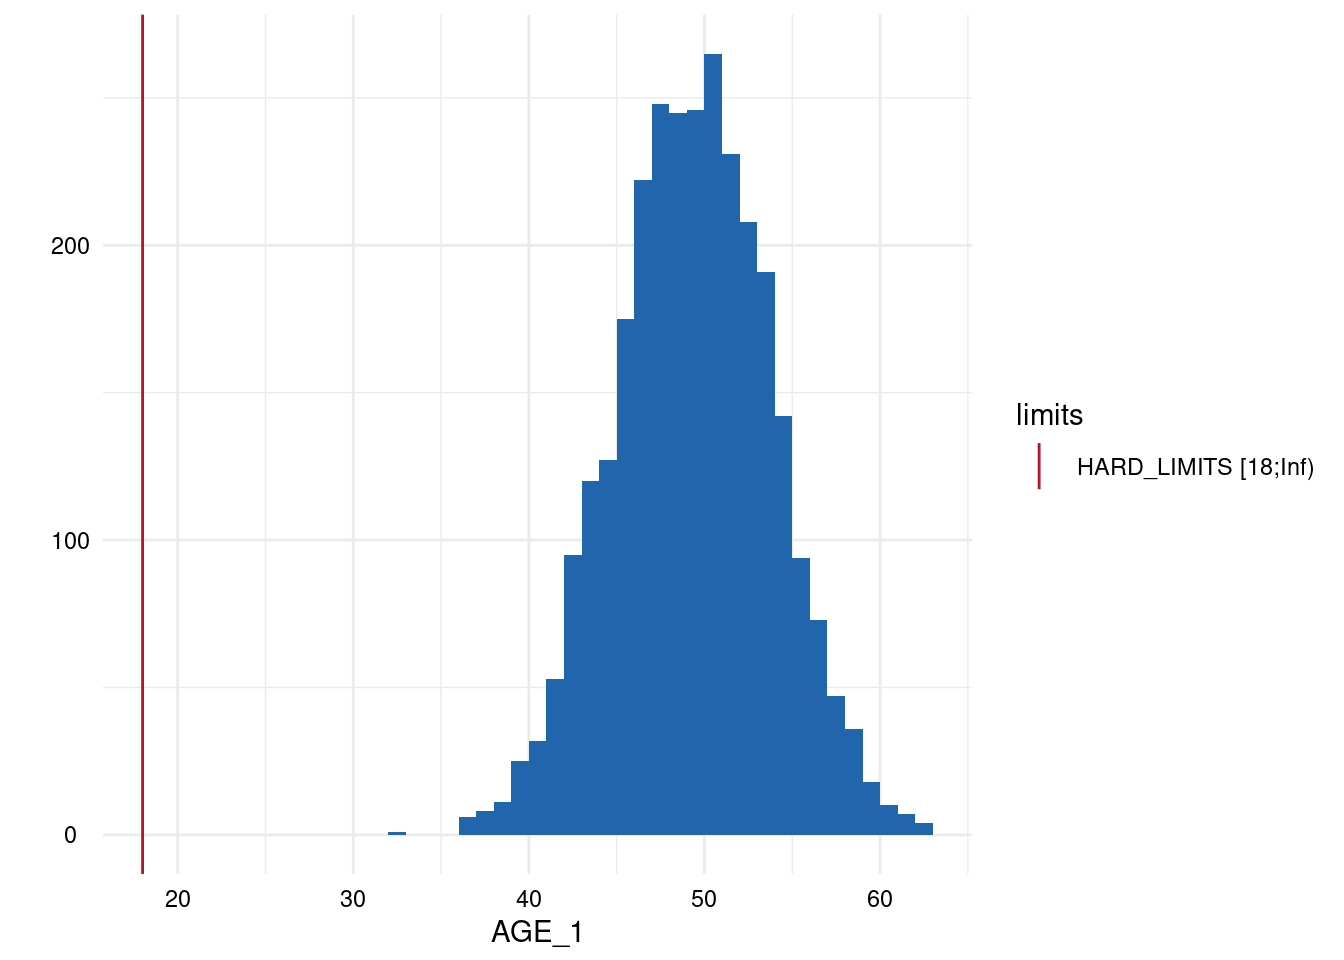
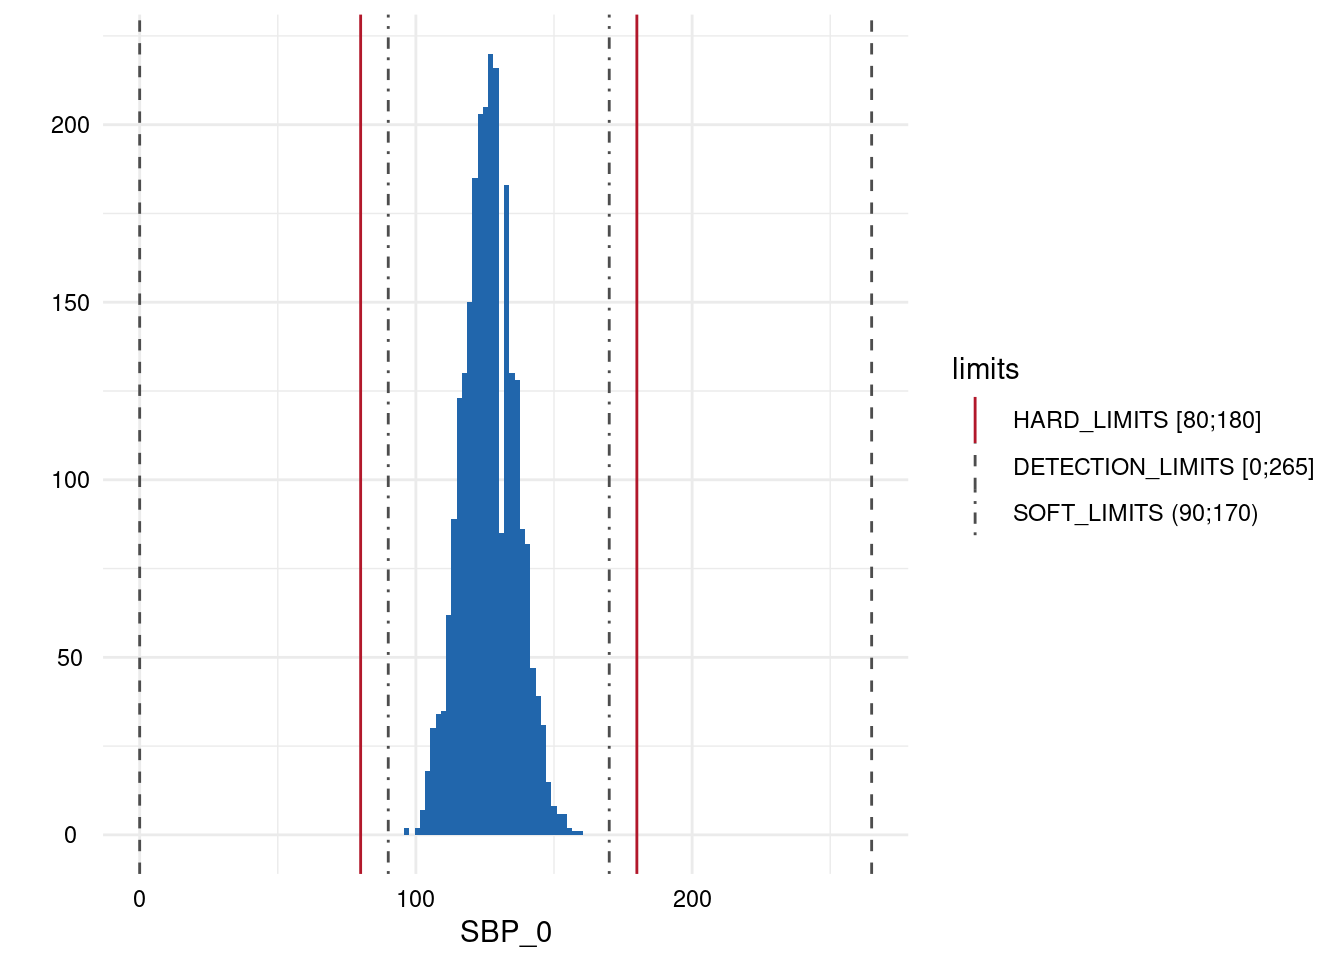
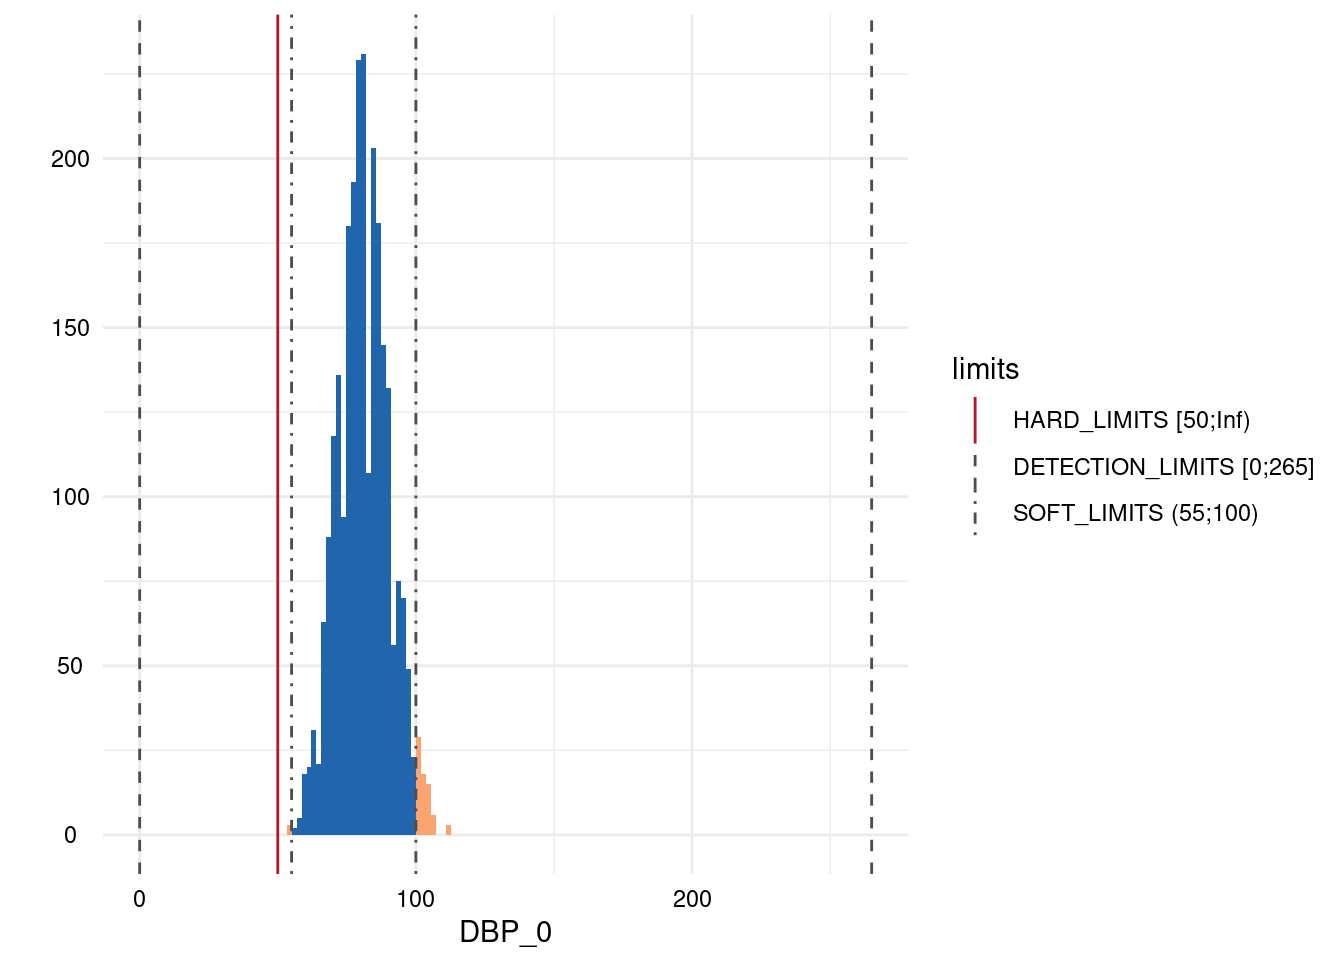
Output 3: Plot List
Here, only five plots are displayed. However, for each variable with limits, a plot has been generated.

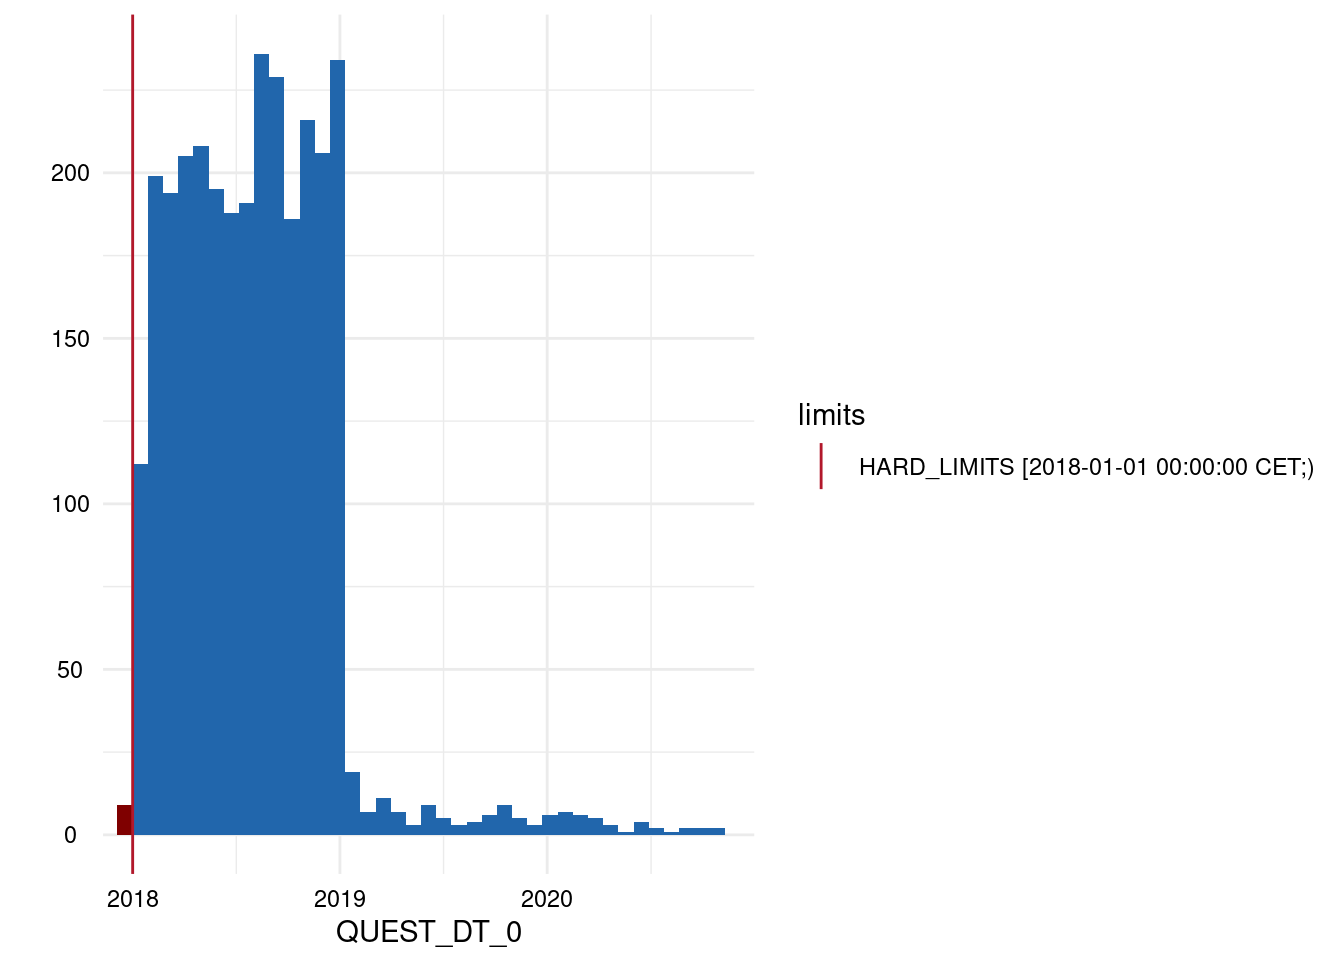
Variables of type datetime
The con_limit_deviations function can also be applied to
datetime variables:
limit_deviations_3 <- con_limit_deviations(resp_vars  = c("QUEST_DT_0"),
                                      label_col  = "LABEL",
                                      study_data = sd1,
                                      meta_data  = md1,
                                      limits     = "HARD_LIMITS")
## Did not find any 'SCALE_LEVEL' column in item-level meta_data. Predicting it from the data -- please verify these predictions, they may be wrong and lead to functions claiming not to be reasonably applicable to a variable.Output 2: Summary Data
| Variables | Section | Limits | Number | Percentage |
|---|---|---|---|---|
| QUEST_DT_0 | below | HARD_LIMITS | 9 | 0.31 |
| QUEST_DT_0 | within | HARD_LIMITS | 2931 | 99.69 |
| QUEST_DT_0 | above | HARD_LIMITS | 0 | 0.00 |
Output 3: Plot List
Interpretation
The definition of HARD_LIMITS is a common issue in the
data curation process. For example, values of a numeric rating scale (0
- 10) should not exceed these limits and values outside these limits
must be removed or at least verified as they represent certain incorrect
measurements. Nevertheless, there are measurements in which the
definition of such limits is difficult. In this case the alternative
definition of SOFT_LIMITS is recommended.
Algorithm of the implementation
- Remove missing codes from the study data (if defined in the metadata)
- Interpretation of variable specific intervals as supplied in the metadata.
- Identification of measurements outside defined limits. Therefore two
output data frames are generated:
- on the level of observation to flag each deviation, and
- a summary table for each variable.
- A list of plots is generated for each variable examined for limit deviations. The histogram-like plots indicate respective limits as well as deviations.
- Values exceeding limits are removed in a data frame of modified study data
Concept relations
- Data quality Indicator Inadmissible numerical values
- Data quality Indicator Inadmissible time-date values
- Data quality Indicator Uncertain numerical values
- Data quality Indicator Uncertain time-date values
