R implementation of contradiction checks
Description
The function con_contradictions considers a
contradiction if impossible or seemingly erroneous combinations of data
are observed in one participant. For example, if age of a participant is
recorded repeatedly, the value of age must be (unfortunately) always
increasing. Most contradiction checks rely on comparing two variables.
Each value used for a comparison may represent a possible
characteristic, but the combination of these two values is considered to
be impossible. Thus, con_contradictions is an
implementation of the Logical
contradictions and Empirical
contradictions indicators, which belong to the Contradictions domain in the Consistency dimension.
The approach does not consider implausible or inadmissible values. For more details, see the user’s manual and the source code.
Usage and arguments
con_contradictions(
  resp_vars = NULL,
  study_data = sd1,
  meta_data = md1,
  label_col = NULL,
  threshold_value = 1,
  check_table = checks,
  summarize_categories = FALSE
)
The con_contradictions function has the following
arguments:
- study_data: mandatory, the data frame containing the measurements.
- meta_data: mandatory, the data frame containing the study data’s metadata.
- label_col: optional, the column in the metadata data frame containing the labels of all the variables in the study data.
- threshold_value: mandatory, a numerical value based on percentages ranging from 0 to 100.
- check_table: mandatory, a data frame defining the contradictions. See the Definition of contradictions for details on the required structure.
- summarize_categories: optional, if
TRUEa summary output is generated for the defined categories plus one plot per category. Requires a column ’tag’ in thecheck_table.
Example output
To illustrate the output, we use the example synthetic data and metadata that are bundled with the dataquieR package. See the introductory tutorial for instructions on importing these files into R, as well as details on their structure and contents.
For the con_contradictions function, the columns
CONTRADICTIONS, MISSING_LIST,
VALUE_LABELS, and HARD_LIMITS in the metadata
are particularly relevant.
The column of CONTRADICTION contains only IDs for
explicit contradictions. The respective definition can be done in the
metadata but we recommend the use of an associated ShinyApp
(Chang et al. 2018,
Potter et al. 2016). See also Definition of contradictions
and Calculation of
contradictions.
Contradictions for this example are loaded as follows:
checks <- read.csv(system.file("extdata",
                               "contradiction_checks.csv",
                               package = "dataquieR"),
                   header = TRUE, sep = "#")
The following table shows the contradictions that were defined for this study data:
| ID | Function_name | A | A_levels | A_value | B | B_levels | B_value | Label |
|---|---|---|---|---|---|---|---|---|
| 1001 | A_less_than_B_vv | AGE_1 | NA | NA | AGE_0 | NA | NA | Age follow-up |
| 1002 | A_not_equal_B_vv | SEX_1 | NA | NA | SEX_0 | NA | NA | Sex follow-up |
| 1003 | A_less_than_B_vv | EDUCATION_1 | NA | NA | EDUCATION_0 | NA | NA | Education follow-up |
| 1004 | A_levels_and_B_levels_ll | EATING_PREFS_0 | vegetarian | NA | MEAT_CONS_0 | 1-2d a week | 3-4d a week | 5-6d a week | daily | NA | Nutrition inconsistency vegetarian |
| 1005 | A_levels_and_B_levels_ll | EATING_PREFS_0 | vegan | NA | MEAT_CONS_0 | 1-2d a week | 3-4d a week | 5-6d a week | daily | NA | Nutrition inconsistency vegan |
| 1006 | A_levels_and_B_levels_ll | EATING_PREFS_0 | none | NA | MEAT_CONS_0 | never | NA | Nutrition inconsistency |
| 1007 | A_levels_and_B_levels_ll | SMOKING_0 | no | NA | SMOKE_SHOP_0 | 1-2d a week | 3-4d a week | 5-6d a week | daily | NA | Non-smokers inconsistency |
| 1008 | A_levels_and_B_levels_ll | SMOKING_0 | yes | NA | SMOKE_SHOP_0 | never | NA | Smokers inconsistency |
| 1009 | A_not_equal_B_vv | ARM_CIRC_DISC_0 | NA | NA | ARM_CUFF_0 | NA | NA | Blood pressure false cuff |
| 1010 | A_levels_and_B_gt_value_lc | PREGNANT_0 | yes | NA | AGE_0 | NA | 55 | Pregnancy high age |
| 1011 | A_less_than_B_vv | LAB_DT_0 | NA | NA | EXAM_DT_0 | NA | NA | LAB before MEX |
The next call specifies the analysis of contradictions, setting the threshold to 1%:
contradictions <- con_contradictions(study_data      = sd1,
                                     meta_data       = md1,
                                     label_col       = "LABEL",
                                     check_table     = checks,
                                     threshold_value = 1)
Output 1: FlaggedStudyData
This implementation returns four objects. The dataframe
FlaggedStudyData flags each observation in the study data
that has one or more contradictions between different variables. For
each applied check on the variables an additional column (names with the
ID of the check) is added. The object can be accessed via
contradictions$FlaggedStudyData.
Output 2: Summary table 1
The second output of the contradiction function is a data frame which
summarizes the number of contradictions for each variable that has been
examined. This object is primarily used by the dataquieR-function
dq_report to summarize the information of all examined
variables.
| Variables | Reference variable | Check ID | Check type | A Levels | B Levels | Contradictions (N) | Contradictions (%) | GRADING | Label |
|---|---|---|---|---|---|---|---|---|---|
| AGE_1 | AGE_0 | 1001 | A_less_than_B_vv | NA | NA | 150 | 5.00 | 1 | Age follow-up |
| SEX_1 | SEX_0 | 1002 | A_not_equal_B_vv | NA | NA | 150 | 5.00 | 1 | Sex follow-up |
| EDUCATION_1 | EDUCATION_0 | 1003 | A_less_than_B_vv | NA | NA | 7 | 0.23 | 0 | Education follow-up |
| EATING_PREFS_0 | MEAT_CONS_0 | 1004 | A_levels_and_B_levels_ll | vegetarian | 1-2d a week|3-4d a week|5-6d a week|daily | 54 | 1.80 | 1 | Nutrition inconsistency vegetarian |
| EATING_PREFS_0 | MEAT_CONS_0 | 1005 | A_levels_and_B_levels_ll | vegan | 1-2d a week|3-4d a week|5-6d a week|daily | 19 | 0.63 | 0 | Nutrition inconsistency vegan |
| EATING_PREFS_0 | MEAT_CONS_0 | 1006 | A_levels_and_B_levels_ll | none | never | 64 | 2.13 | 1 | Nutrition inconsistency |
Output 3: Summary table 2
The third output summarizes this information in a similar way, but also names the applied checks. This output can be used to provide an executive overview on the amount of contradictions.
| Check ID | Check type | Variables A and B | A Levels | B Levels | Contradictions (N) | Contradictions (%) | GRADING | Label |
|---|---|---|---|---|---|---|---|---|
| 1001 | A_less_than_B_vv | A is: AGE_1; B is: AGE_0 | NA | NA | 150 | 5.00 | 1 | Age follow-up |
| 1002 | A_not_equal_B_vv | A is: SEX_1; B is: SEX_0 | NA | NA | 150 | 5.00 | 1 | Sex follow-up |
| 1003 | A_less_than_B_vv | A is: EDUCATION_1; B is: EDUCATION_0 | NA | NA | 7 | 0.23 | 0 | Education follow-up |
| 1004 | A_levels_and_B_levels_ll | A is: EATING_PREFS_0; B is: MEAT_CONS_0 | vegetarian | 1-2d a week|3-4d a week|5-6d a week|daily | 54 | 1.80 | 1 | Nutrition inconsistency vegetarian |
| 1005 | A_levels_and_B_levels_ll | A is: EATING_PREFS_0; B is: MEAT_CONS_0 | vegan | 1-2d a week|3-4d a week|5-6d a week|daily | 19 | 0.63 | 0 | Nutrition inconsistency vegan |
| 1006 | A_levels_and_B_levels_ll | A is: EATING_PREFS_0; B is: MEAT_CONS_0 | none | never | 64 | 2.13 | 1 | Nutrition inconsistency |
| 1007 | A_levels_and_B_levels_ll | A is: SMOKING_0; B is: SMOKE_SHOP_0 | no | 1-2d a week|3-4d a week|5-6d a week|daily | 91 | 3.03 | 1 | Non-smokers inconsistency |
| 1008 | A_levels_and_B_levels_ll | A is: SMOKING_0; B is: SMOKE_SHOP_0 | yes | never | 118 | 3.93 | 1 | Smokers inconsistency |
| 1009 | A_not_equal_B_vv | A is: ARM_CIRC_DISC_0; B is: ARM_CUFF_0 | NA | NA | 173 | 5.77 | 1 | Blood pressure false cuff |
| 1010 | A_levels_and_B_gt_value_lc | A is: PREGNANT_0; B is: AGE_0 | yes | NA | 5 | 0.17 | 0 | Pregnancy high age |
| 1011 | A_less_than_B_vv | A is: LAB_DT_0; B is: EXAM_DT_0 | NA | NA | 116 | 3.87 | 1 | LAB before MEX |
Output 4: Summary plot
The fourth output visualizes summarized information of output 2 and 3.
contradictions$SummaryPlot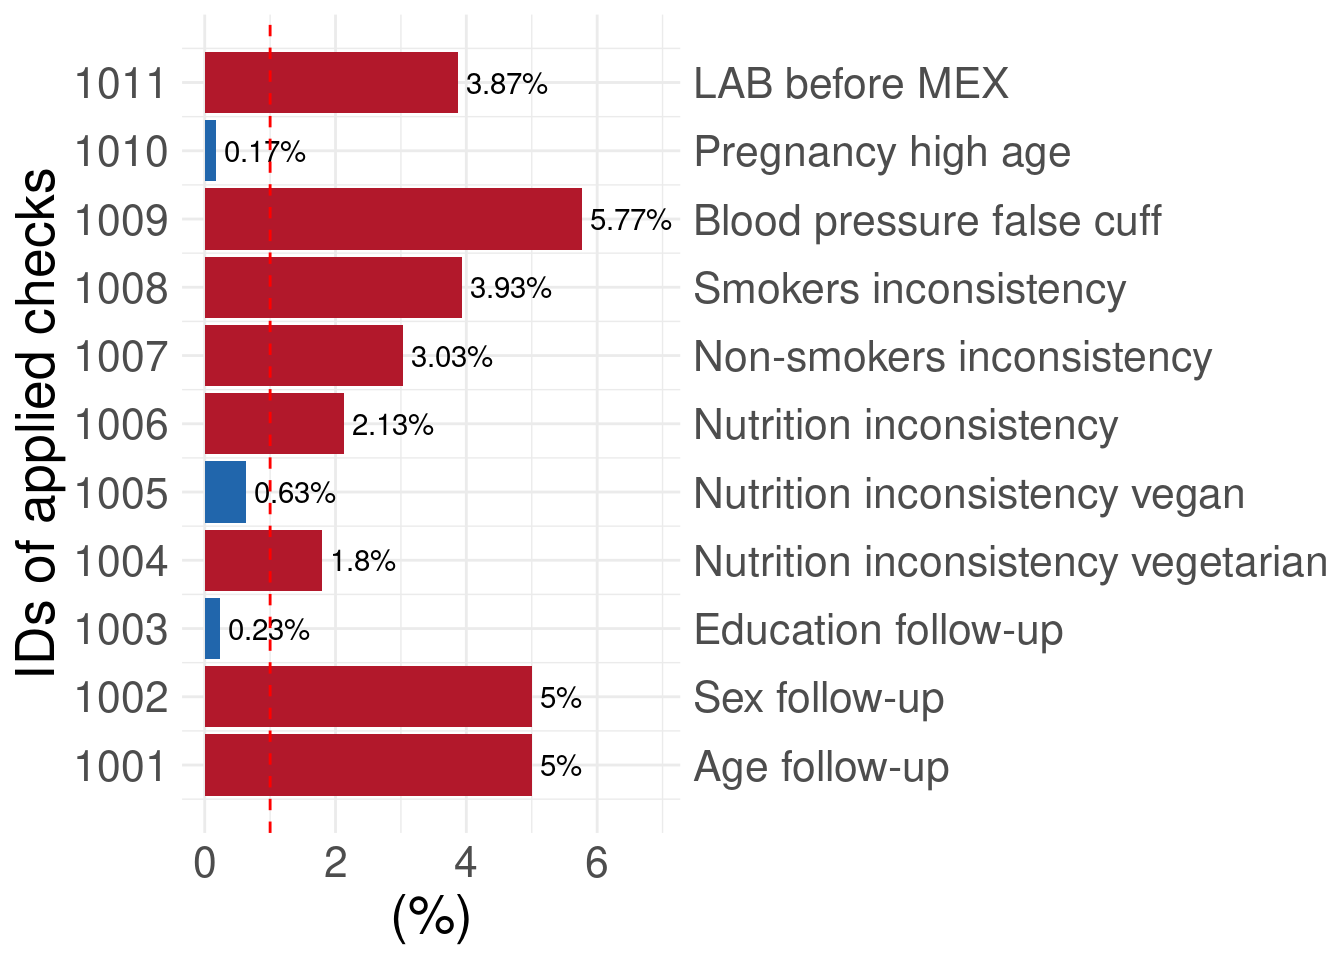
Interpretation
Any contradiction in the study data should be resolved by appropriate data curation steps.
Algorithm of the implementation
- Select all variables in the data with defined contradiction rules
(static metadata column
CONTRADICTIONS) - Remove missing codes from the study data (if defined in the metadata)
- Remove measurements deviating from limits defined in the metadata
- Assign label to levels of categorical variables (if applicable)
- Apply contradiction checks on predefined sets of variables
- Identification of measurements fulfilling contradiction rules.
Therefore two output data frames are generated:
- on the level of observation to flag each contradictory value combination, and
- a summary table for each contradiction check.
- A summary plot illustrating the number of contradictions is generated.
Definition of contradictions
To a large extent contradictions can be defined via logical comparison of variables. Assume \(A\) and \(B\) to represent two variables in the study data. Then:
if \(A \gt B\) a contradiction may follow
if \(A\) is not missing, then \(B\) should not be observed
if \(A \lt 18\) then \(B \ne \:"adult"\)
Defining such comparisons is supported by a Shiny App allowing the specification of checks in a standardized manner. Therefore a comprehensive table of metadata is required.
CAVEAT: For the time being, contradiction checks can be defined for the contradictions between two variables only.
Calculation of contradictions
The indicator uses a list of prespecified functions of logical comparisons. Each of the functions is designed to indicate a contradiction if the specified criteria are met.
The suffixes _vv, _ll, _lc are
required for the ShinyApp mentioned above and have no interpretation in
the context of contradictions.
A_not_equal_B_vv <- function(study_data,
                             A, B, A_levels, B_levels, A_value, B_value) {
  X <- study_data
  grading <- ifelse(X[[A]] != X[[B]], 1, 0)
  return(grading)
}
All dataquieR functions of logical comparisons have seven arguments:
- study_data: the name of the data frame containing the study data
- A: one variable in which a contradiction may occur
- B: the second required variable to evaluate a contradiction
- A_levels: in case A is nominal, the respective levels are used here
- B_levels: in case B is nominal, the respective levels are used here
- A_value: in case a value of A is used for comparison with B
- B_value: in case a value of B is used for comparison with A
Concept relations
- Data quality Indicator Empirical contradictions
- Data quality Indicator Logical contradictions
